
The 7 Marketing Metrics Every Contractor Needs
Most contractors know their ad spend. Almost none know their answer rate, booking rate, or revenue per marketing dollar. Here's what to track — and what the numbers mean.
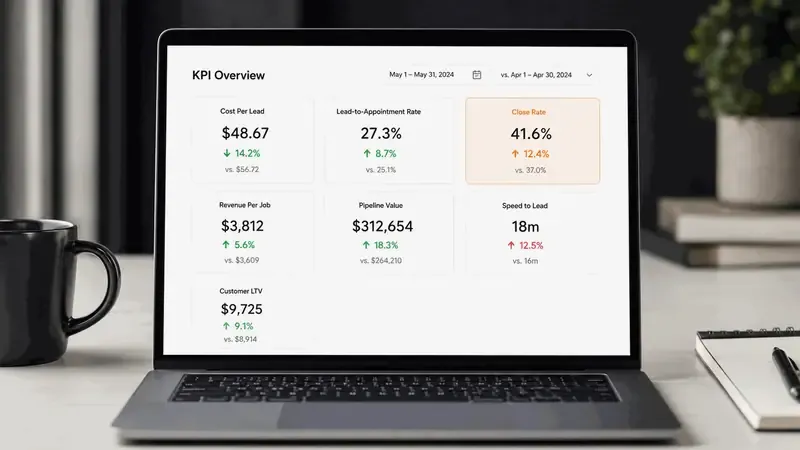
Ask most contractors what their marketing is generating and they'll tell you their monthly ad spend. Ask for their cost per lead and they'll estimate. Ask for their booking rate and they'll go quiet.
This is the norm. Most trade contractors run marketing on feel. What's missing is the chain that connects a dollar of ad spend to a signed contract. Without it, you can't fix anything — because you can't tell whether a slow month is a lead problem, a booking problem, a close rate problem, or a follow-up problem.
Why Most Contractors Are Flying Blind
The tracking gap has two causes. First, the tools that run your jobs (scheduling, invoicing) usually don't talk to the tools that run your marketing (ad platforms, CRM, call tracking). Second, most agencies report vanity numbers — impressions, clicks, CTR — instead of revenue numbers. A 2% click-through rate is trivia. Revenue per marketing dollar tells you what to do next.
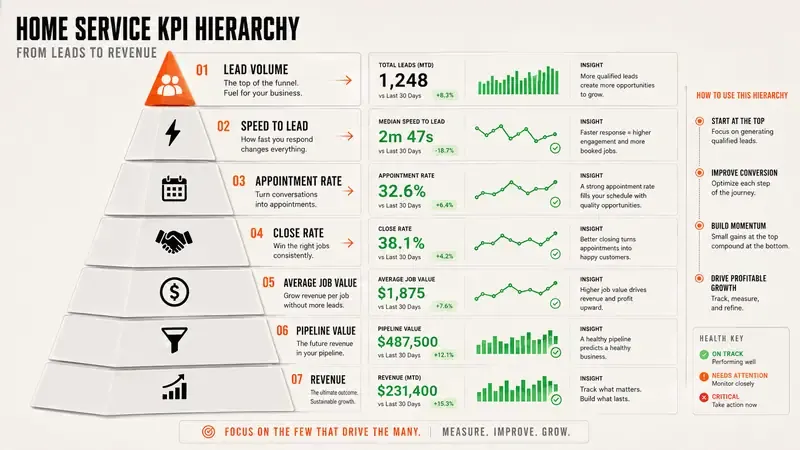
The 7 Metrics That Predict Revenue
| METRIC | INDUSTRY AVG | TOP PERFORMER | PRIMARY LEVER |
|---|---|---|---|
| Cost per lead | $45–90 | $25–45 | Ad targeting + landing page match |
| Answer rate | 40–55% | 90–100% | AI receptionist + call routing |
| Booking rate | 30–40% | 60–70% | Speed-to-lead + AI booking |
| Estimate show rate | 75–80% | 90–95% | Confirmation + reminder sequences |
| Close rate | 22–28% | 35–45% | Pre-visit trust + follow-up system |
| Avg job value | Varies by trade | +20–35% vs avg | Authority positioning, no discounting |
| Revenue per $1 ad spend | $8–14 | $22–35 | All 6 metrics above combined |
Cost Per Lead: What's Normal by Trade
Cost per lead is total marketing spend divided by qualified inbound leads (calls + forms) in a period. Current benchmarks for well-managed campaigns:
- ✓ Roofing replacement: $35–65/lead (storm season: $65–90)
- ✓ HVAC replacement: $45–80/lead
- ✓ Kitchen remodel: $55–100/lead (but average ticket $25K+)
- ✓ Bath remodel: $40–75/lead
- ✓ Windows & Doors: $35–60/lead
- ✓ Pool installation: $70–120/lead
- ✓ Flooring: $25–50/lead
A high cost per lead is not automatically a problem — it depends entirely on average job value and close rate. A kitchen remodeler paying $90/lead and closing 25% of their estimates is generating a $360 cost per closed job on a $35,000 average ticket. That's excellent. A roofer paying $90/lead and closing 15% on an $11,000 ticket is generating a $600 cost per closed job. That's a close rate problem, not a CPL problem.
Answer Rate: The Metric Nobody Tracks
Answer rate is the percentage of inbound calls that reach a system capable of qualifying and booking the lead. Industry average: 40–55%. That means for every 10 calls your marketing generates, 4–6 go to voicemail. Most don't become leads at all — the homeowner moves on.
More leads captured from the same ad spend — by moving answer rate from 50% to 90%. No new ads. No new budget. Just not missing calls.
An AI receptionist that answers every call in under 12 seconds eliminates answer rate as a problem entirely. The system answers 100% of calls, qualifies leads, and books estimate appointments — including at 9pm on a Saturday. Answer rate goes from 40% to 100%.
Booking Rate
Booking rate is the percentage of answered leads that result in a confirmed estimate appointment. Industry average: 30–40%. Top performers: 60–70%.
At 50 answered leads per month — the math is striking:
- ✓ At 35% booking rate: 17.5 booked estimates
- ✓ At 65% booking rate: 32.5 booked estimates
- ✓ 15 additional estimate appointments per month from the same lead volume
- ✓ At 25% close rate and $14,000 avg job: $52,500 additional monthly revenue
Close Rate
Close rate is the percentage of in-home estimates that result in a signed contract. Industry average: 22–28%. Top performers: 35–45%.
Most contractors assume a low close rate means weak sales skills. More often, the homeowner just doesn't trust you yet. What they see before the visit — your Google review count, your project portfolio, the confirmation email after booking, the intro text the morning of the estimate — decides whether you walk in as just another bid or as the expert. By the time you ring the doorbell, much of the job is already won or lost.
Revenue Per Marketing Dollar
Revenue per marketing dollar collapses the entire funnel into one number: total attributed revenue divided by total marketing spend. Industry average: $8–14. Top performers: $22–35.
The difference between $10 and $25 per marketing dollar isn't one improvement — it's the compounded effect of improvements across all 6 upstream metrics. A contractor who improves answer rate from 45% to 90%, booking rate from 35% to 60%, and close rate from 25% to 38% has transformed revenue per marketing dollar from $9 to $26+ with no increase in ad spend.
This is why Deals To Grow builds a full infrastructure stack rather than running ads in isolation. See the full 9-system stack or book a scoping call to discuss your current numbers.
Related Articles.
Want this system installed for your trade?
See if your market is still open, then book a 20-30 minute install call. No contracts.